1、
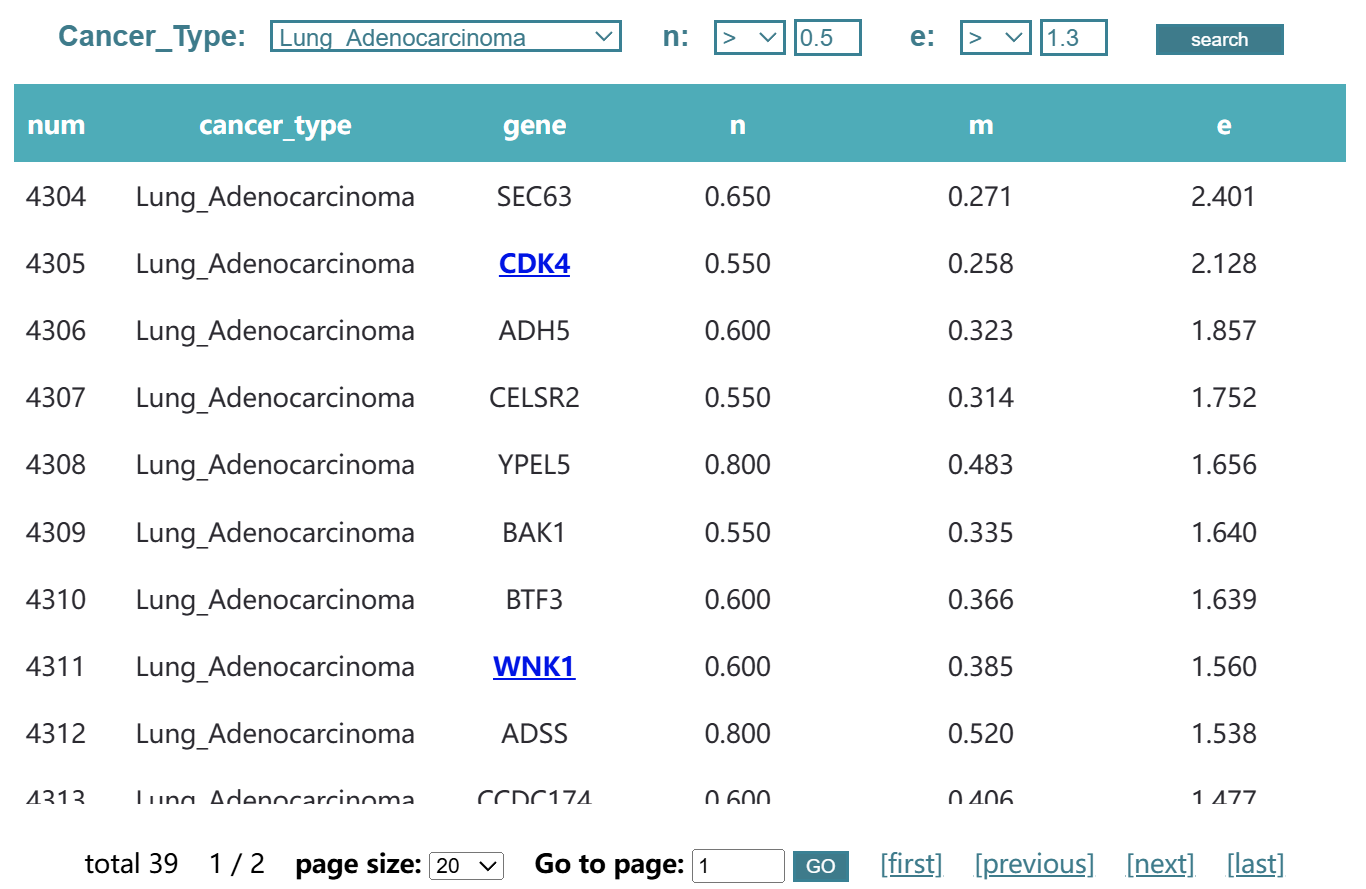
In the "Target" interface, users can browse the GeneSpecificityScore(e-value) of 7470 essential genes in 19 cancer types.If users click on a gene, e.g. "SCD", the page will switch to the new interface, which displays information about the drug corresponding to "SCD".If there is no link, it means that the target has no matching drugs in our data collection.
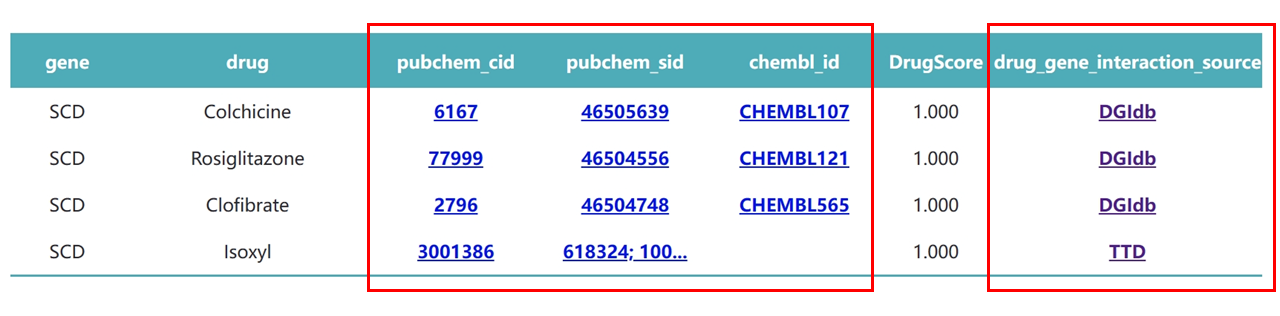
By clicking on the links corresponding to the three ids in the figure, users can browse the drug-specific information in the PubChem and ChEMBL databases. In addition, by clicking on the links in the drug_gene_interaction_source column, the user can browse the specific information in the databases that provide gene-drug records.
2、
In the 'Supplement' interface, we have supplemented the GeneSpecificityScore(e-value) of 7470 essential genes in 13 cancer types with fewer than 5 cell lines. The remaining functions are the same as those in the 'Target' interface.
3、
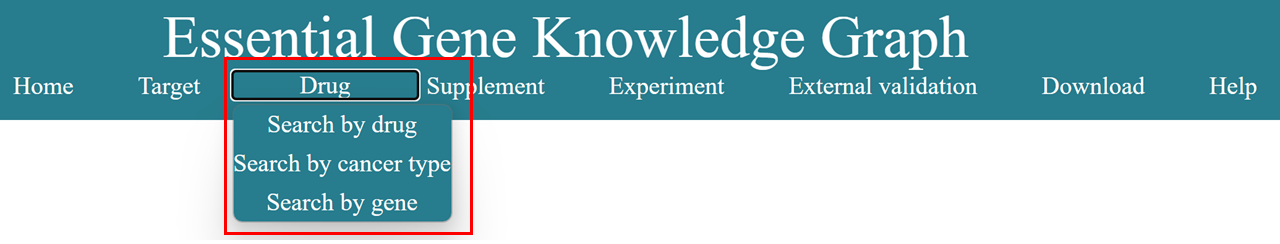
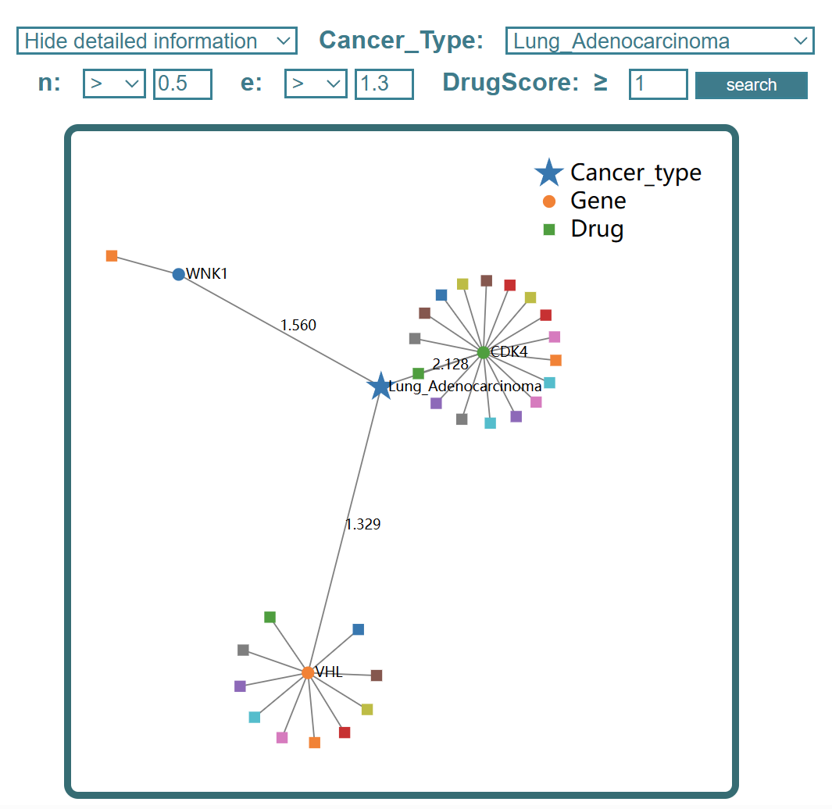
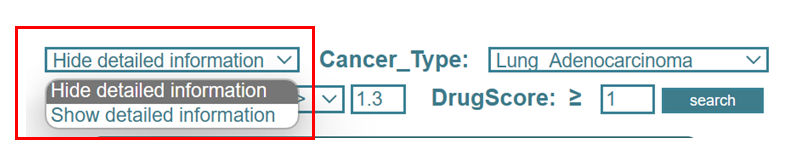
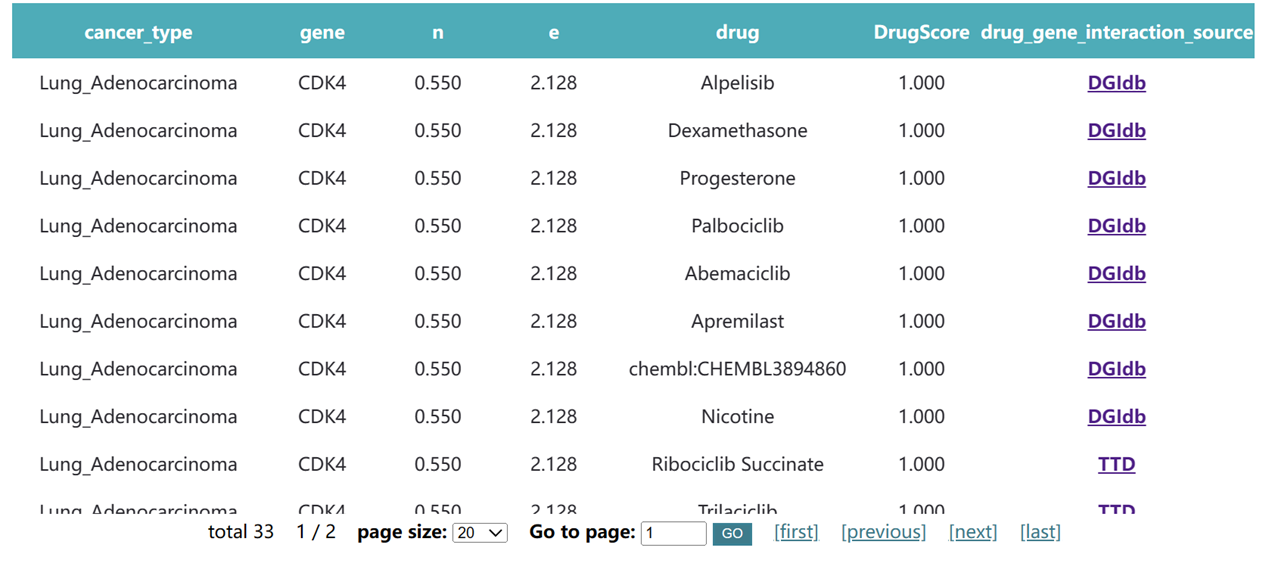
In the "Drug" interface, users can browse the corresponding knowledge graph based on drug, cancer type and gene respectively. Take "Search by cancer type" as an example, users can select a cancer type and set the filter conditions to view the knowledge graph, and the distance in the knowledge graph indicates the proximity of the relationship between two entities.
In addition, the user can choose whether to show the detailed information or not, if the user chooses to show, the table information in the figure will appear.
4、
In the "Experiment" interface, we present the in vitro cell experimental results of drugs identified based on cancer-specific targets.These experimental results are from our own.
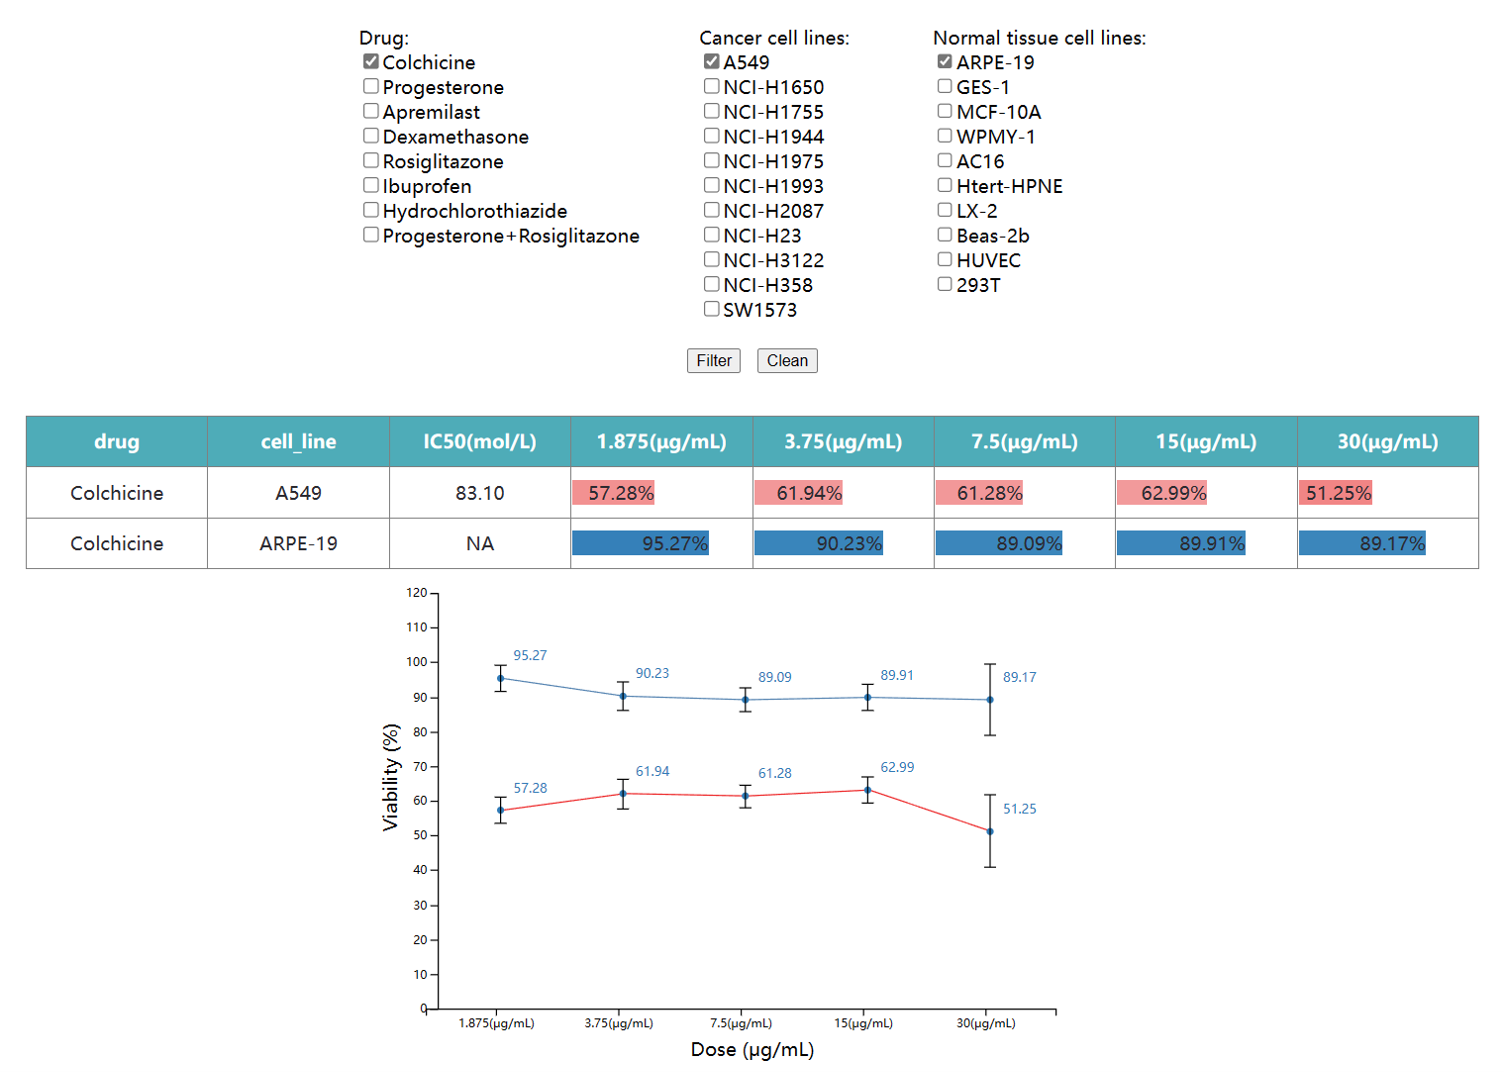
The table in the figure showcases the inhibition effects of drugs on cancer cell lines, with the red bar graph indicating the degree of inhibition. The darker the shade of red, the better the inhibitory effect of the drug on the cancer cell lines. The blue bar graph represents the cytotoxic effects of the drugs on normal cell lines, with darker blue shades indicating lesser harm to normal cells. The line graph in the figure depicts the trend of drug effects on cell lines at different concentrations.
5、
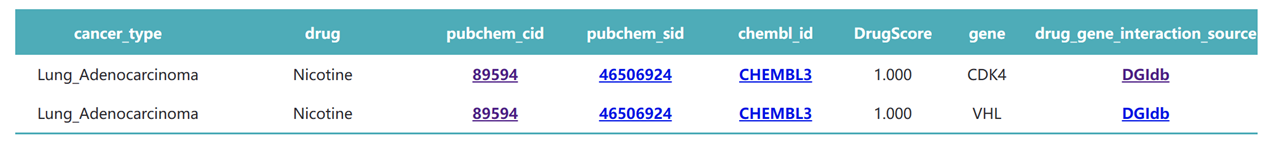
In the "External validation" interface, users can search by cancer type for drugs with cellular experiments in DepMap.
When the user clicks on the corresponding link under
the "gene" column, the user can query multiple genes corresponding to the
drug. For example, if you click on the gene "CDK4" corresponding to "Nicotine",
the genes "CDK4" and "VHL" of "Nicotine" can be searched.
When the user clicks on the corresponding link under the "Visualization" column, the user can switch to the knowledge graph of the corresponding drug.
6、
In the "Download" interface, users can download the data of their interest.
7、
If you find any error in data or bug in web service, please kindly contact with us:
<kuangxia@whu.edu.cn>